Introduction
The Airbnb Quality Dashboard is a powerful analytics and management tool designed to help property managers monitor listing performance, understand guest feedback, and proactively improve quality across their portfolio.
By consolidating Airbnb review data into a single, visual interface, the dashboard enables you to:
Detect performance trends early
Identify operational issues
Improve guest satisfaction
Ultimately increase bookings and revenue
Accessing the Dashboard
There are 2 different dashboards that complete the Airbnb Quality Dashboard: The Airbnb Review Quality Dashboard analyzes the quality, consistency, and sentiment of guest reviews across the platform to identify issues like low-quality or biased feedback, enhancing trust and user experience, while the Airbnb Listings Quality Dashboard gives hosts a centralized view of key performance metrics for their own listings, helping them monitor ratings and improve listing performance.
You can access them by going to:
Channel Manager > Airbnb > Airbnb Reviews (Airbnb Review Quality Dashboard)
Channel Manager > Airbnb > Airbnb Dashboard (Airbnb Listings Quality Dashboard)
Airbnb Review Quality Dashboard
The Airbnb Review section provides a detailed, review-level view of all feedback received from your guests. This area is designed to give you a complete picture of how your listings are performing, allowing you to understand both the positive aspects of your operations and the areas that may need attention.
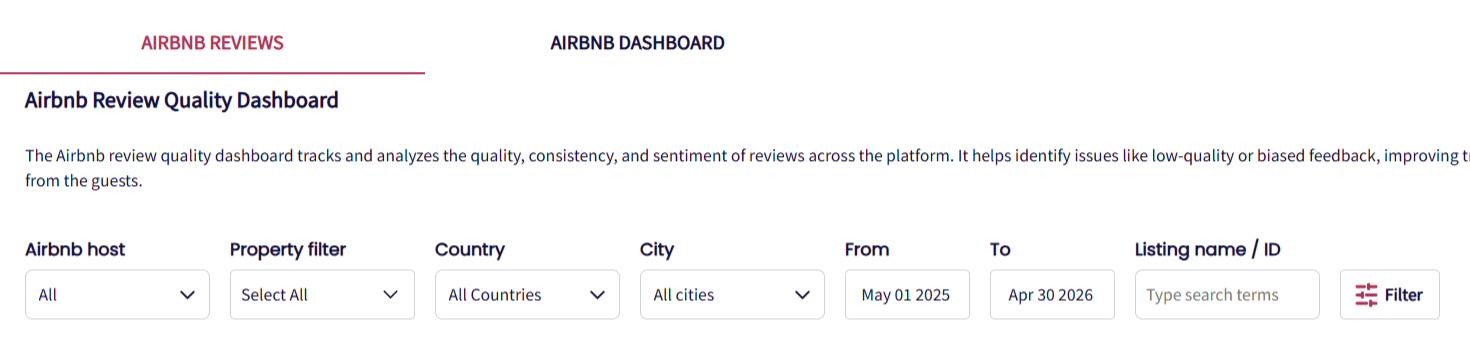
Filter reviews
The dashboard allows you to refine your view according to the specific level of detail you need. You can filter by an individual property if you want to focus on a single unit, by a property group if you want to evaluate a specific cluster of listings, or by the entire portfolio to get an overview of your overall performance. Additionally, you can select a custom date range - such as the current month, previous months, or even last quarter so you can analyze trends over time.
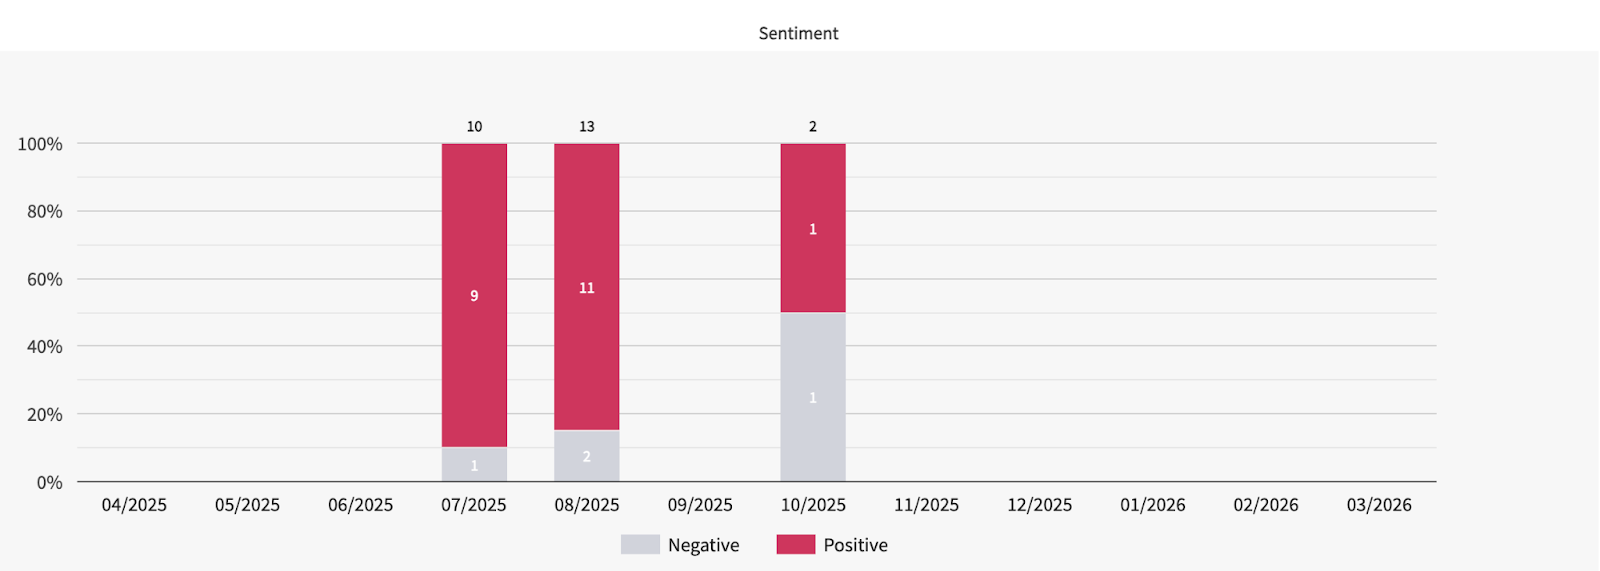
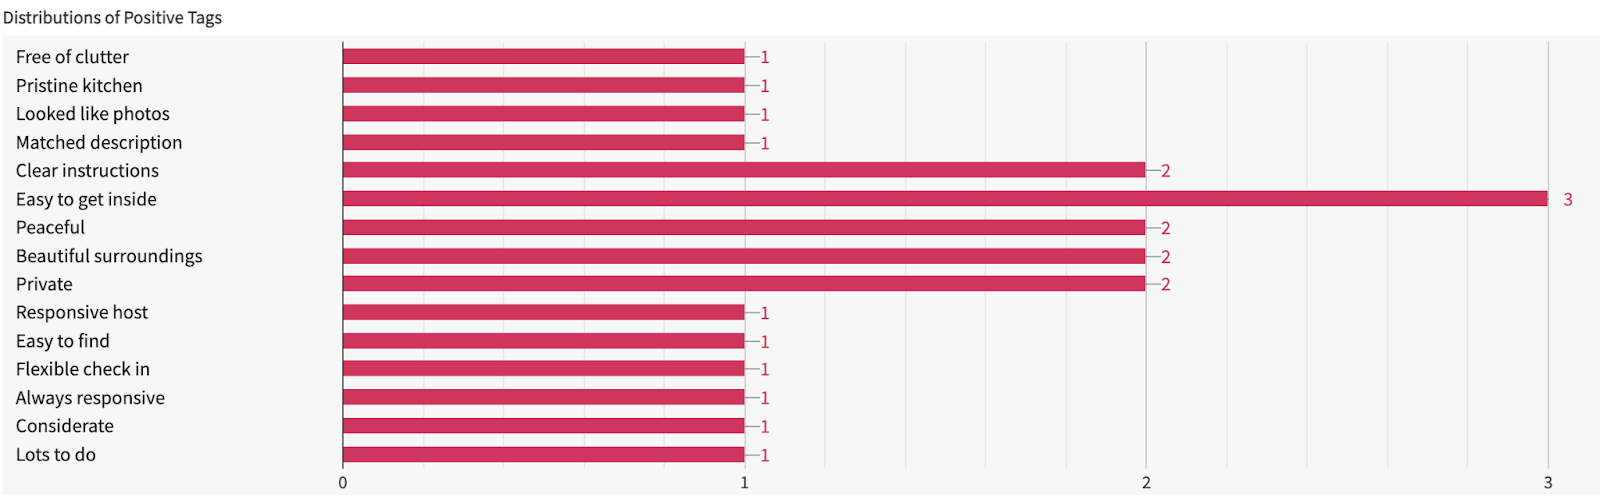
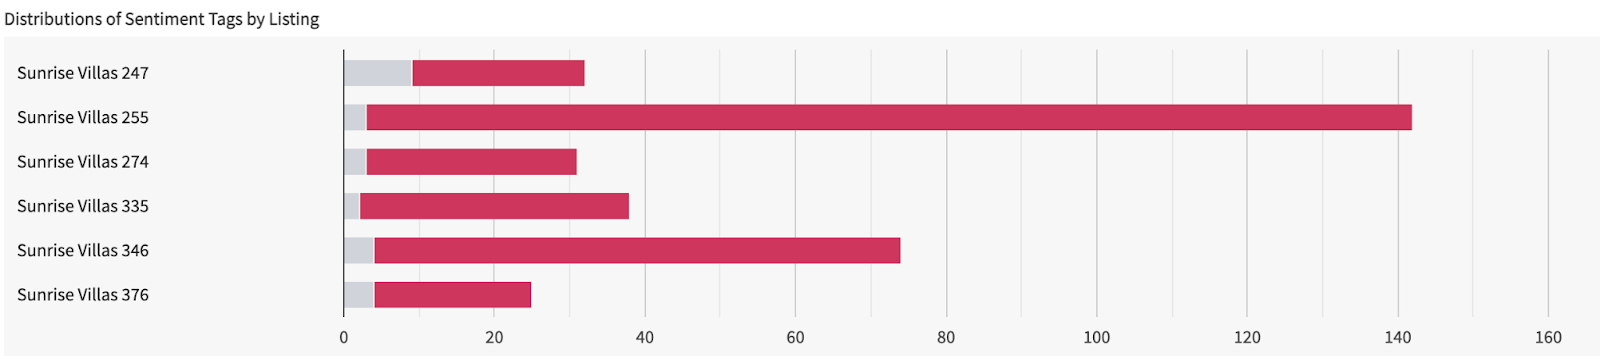
Review sentiment analysis
Airbnb assigns tags or sentiment categories to each review. These tags break down feedback into specific areas such as cleaning, communication, check-in processes, and accuracy of the listing.
The dashboard aggregates this information, showing the distribution of positive and negative sentiment across your properties. For instance, if 30% of your negative feedback relates to cleaning, it immediately highlights an area where operational improvements are needed. This feature turns raw review text into actionable insights, enabling you to focus resources efficiently and proactively address issues before they escalate.
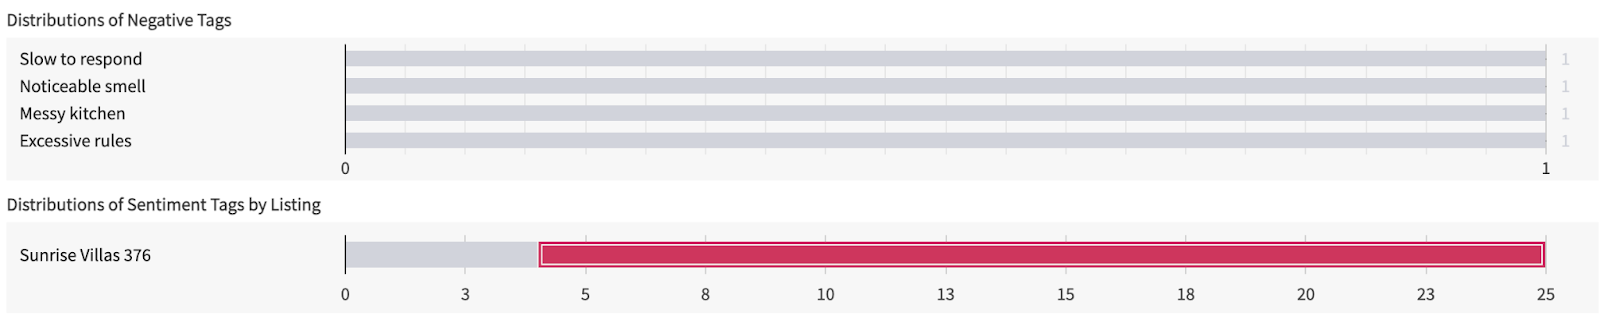
Property-level breakdown
When selecting all or groups of properties, at the bottom of the page, the dashboard presents a property-by-property breakdown of all reviews. This view allows you to quickly scan each listing’s performance, compare them to other properties, and identify which listings are excelling and which require attention.
By combining high-level trend data with detailed, property-specific insights, this section ensures you have a complete understanding of your portfolio’s performance and are equipped to make informed decisions that improve guest satisfaction and boost overall listing quality.
Airbnb Listings Quality Dashboard
The Airbnb Listings Quality Dashboard is the central hub for analyzing and monitoring the overall performance of your Airbnb listings. Unlike the review-level view, which focuses on individual guest feedback, this section aggregates review data across your portfolio, presenting it in an easy-to-read, visual format. The dashboard is designed to give you insights into long-term trends, identify recurring issues, and help you make informed decisions to improve your listings and operations.
Please note that the data in this dashboard is available starting from April 2026 (or from the date your Airbnb account was connected), and does not include historical data prior to that.
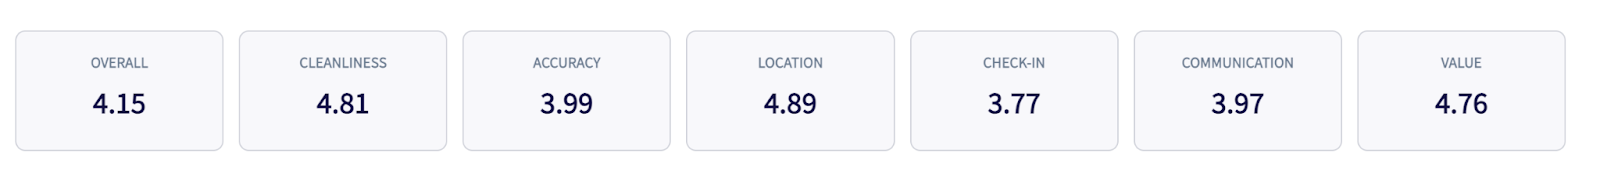
Category breakdown
A major advantage of the Quality Dashboard is its detailed category breakdown, where Airbnb organizes guest feedback into specific categories, each rated on a scale of up to 5, such as:
Overall
Cleanliness
Accuracy
Location
Check-in
Communication
Value
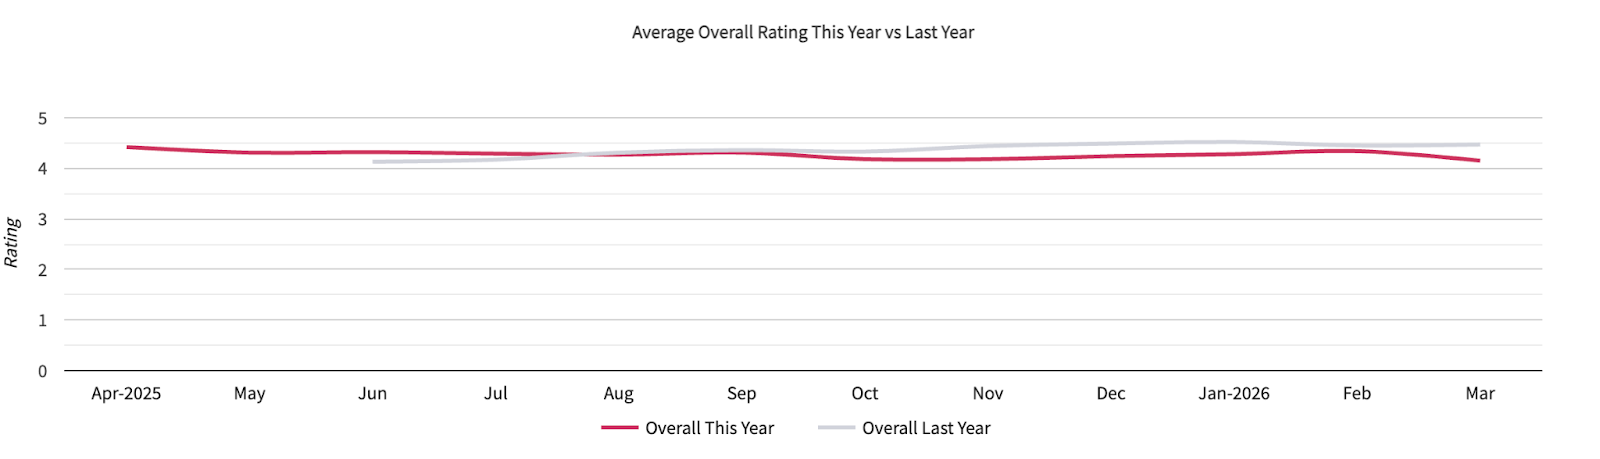
Overall ratings comparison
You will also find a comparison of overall ratings between the current year and the previous year. These ratings are displayed as color-coded graphs, making it simple to visualize improvements or declines over time. For example, last year’s ratings may be shown in gray while the current year’s data is highlighted in magenta, giving you a quick, visual comparison at a glance.
Trend analysis
Beyond category-specific scores, the dashboard also helps you detect patterns and trends. You can view data by month, enabling you to monitor seasonal variations, the effect of operational changes, or the impact of special promotions.
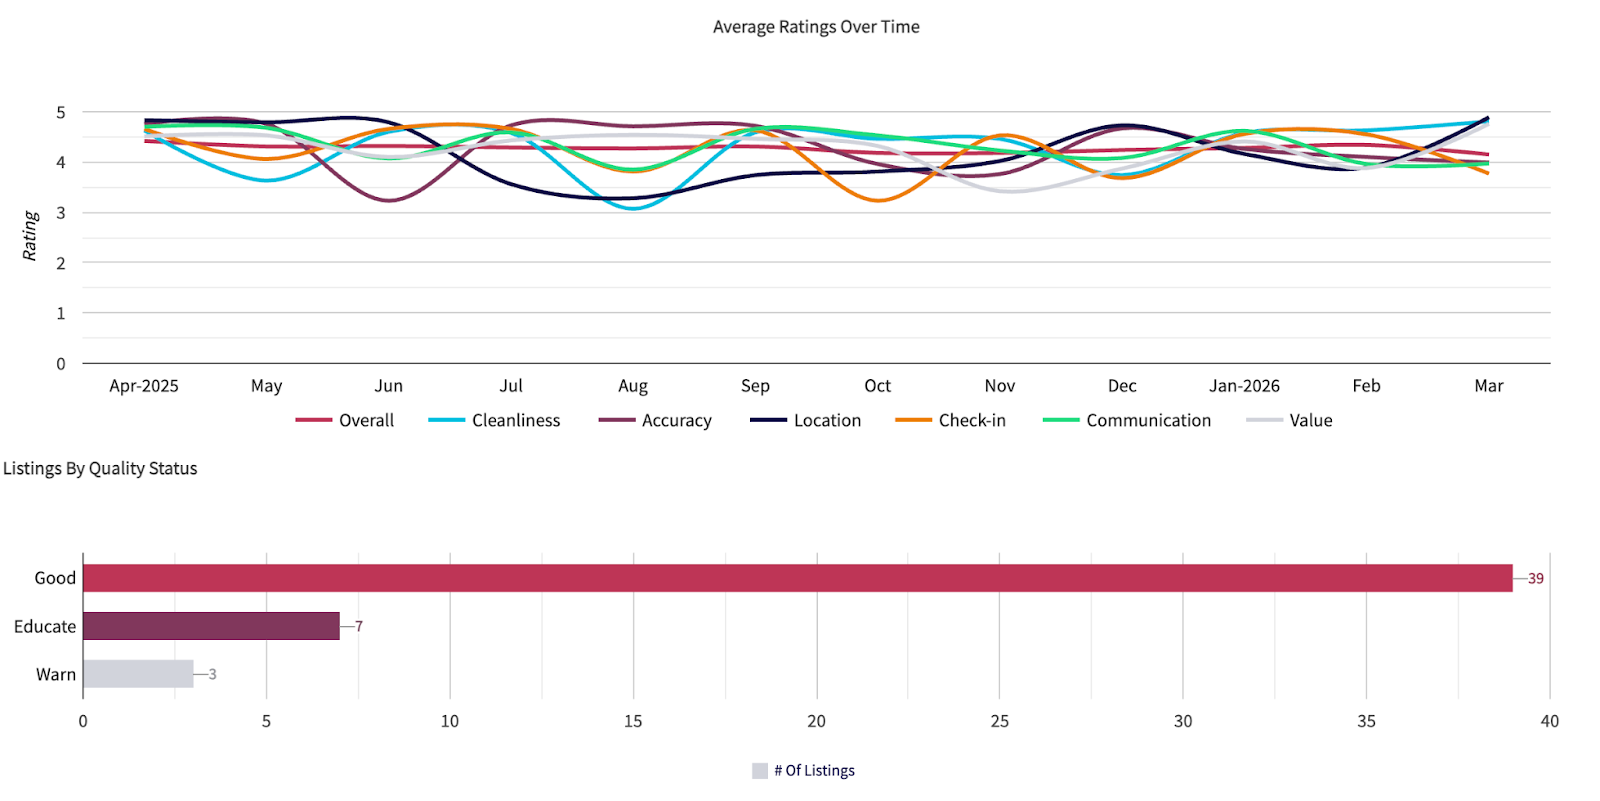
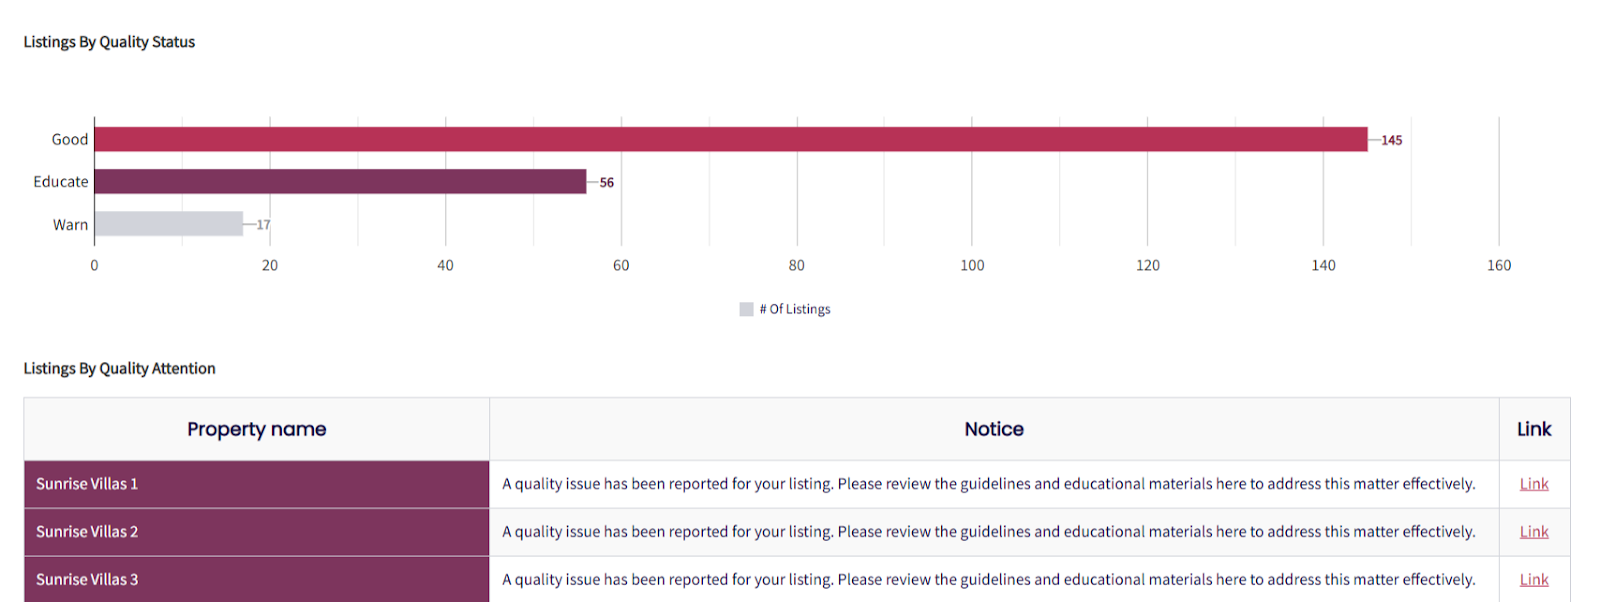
Listings By Quality Status
These statuses are based on Airbnb’s ongoing monitoring of listing performance and guest experience and are important for maintaining the overall quality of your listings.
For more detailed insights at the individual listing level, please refer to Listings By Quality Attention.
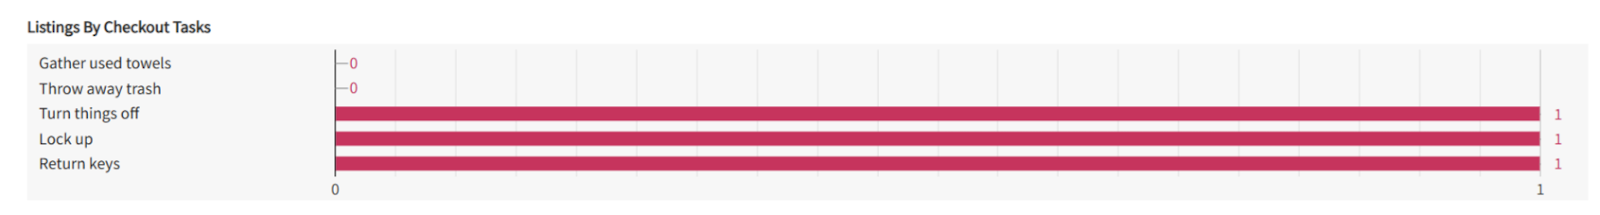
Listings By Checkout Tasks
This section shows how many properties have checkout tasks configured.
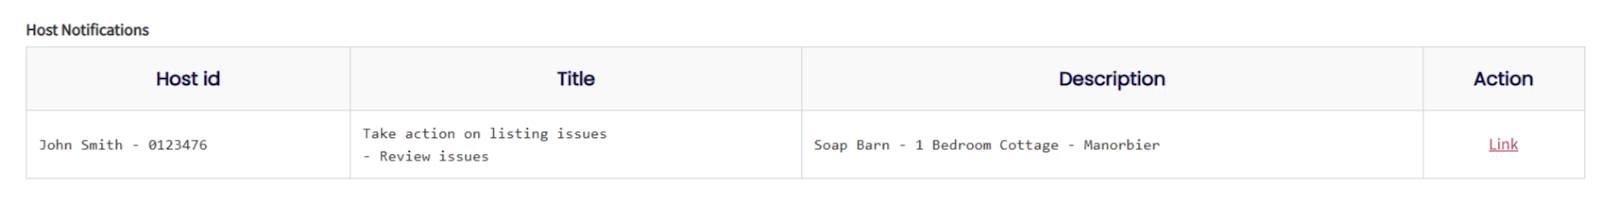
Host Notifications
These notifications help hosts stay informed when any action is required for their listings. Hosts are encouraged to review and address issues promptly to maintain the performance of their listings.
Actionable insights
The Quality Dashboard is designed to be more than just a reporting tool, it provides actionable insights that you can use to improve your listings.
For example, if the dashboard shows declining communication scores, you can review guest messages, identify common complaints and implement new templates or automated responses. Similarly, if accuracy ratings are low, it may indicate that listing descriptions are inconsistent with the property’s actual features, prompting a review and update of your listings.
You might notice that check-in ratings drop during high-occupancy periods. By spotting this trend early, you can adjust staffing, improve guest instructions or add additional support during busy seasons.
Example workflow:
Spot a decline in cleaning ratings for a specific property.
Drill down to individual reviews to see the exact complaints.
Update cleaning procedures or retrain housekeeping staff.
Track subsequent improvements in the dashboard over the next month.
Together, the Reviews and Listings Quality Dashboards give you full visibility into guest feedback and property performance, empowering you to make data-driven decisions that enhance both quality and bookings.
Was this article helpful?
That’s Great!
Thank you for your feedback
Sorry! We couldn't be helpful
Thank you for your feedback
Feedback sent
We appreciate your effort and will try to fix the article